Pen Plotters
If you’re a fan of generative art, chances are you’ve come across artists using pen plotters to translate their digital works to paper. I’m personally a big fan of working with pen and paper, but in recent years have been pulled deep into the digital realm and have created few tangible pieces. I’ve been quite interested in pen plotters for some time as a means to combine the two worlds but never had the opportunity to play with one until I was sent an iDraw Pen Plotter for review. In addition to the review, this article documents my experience working with plotters for the first time and discusses some techniques for going from TouchDesigner to plotter.
If you want to know more about pen plotters, All3DP has a great breakdown of their history, function along with a comparison of various pen plotters on the market in 2021. Generative Hut also has plotter reviews and some great articles and tools available to help one get started and inspired.
Download the TouchDesigner examples from this article. TouchDesigner build used: 2021:14360
Feel free to comment if you have questions or suggestions!
An example of my previous hand drawn ink work (from tiny.planets, 2015.) It looks as if it might be generative art, but is not as no pseudo-randomness was involved in the decision making process.
iDraw Pen Plotter Review
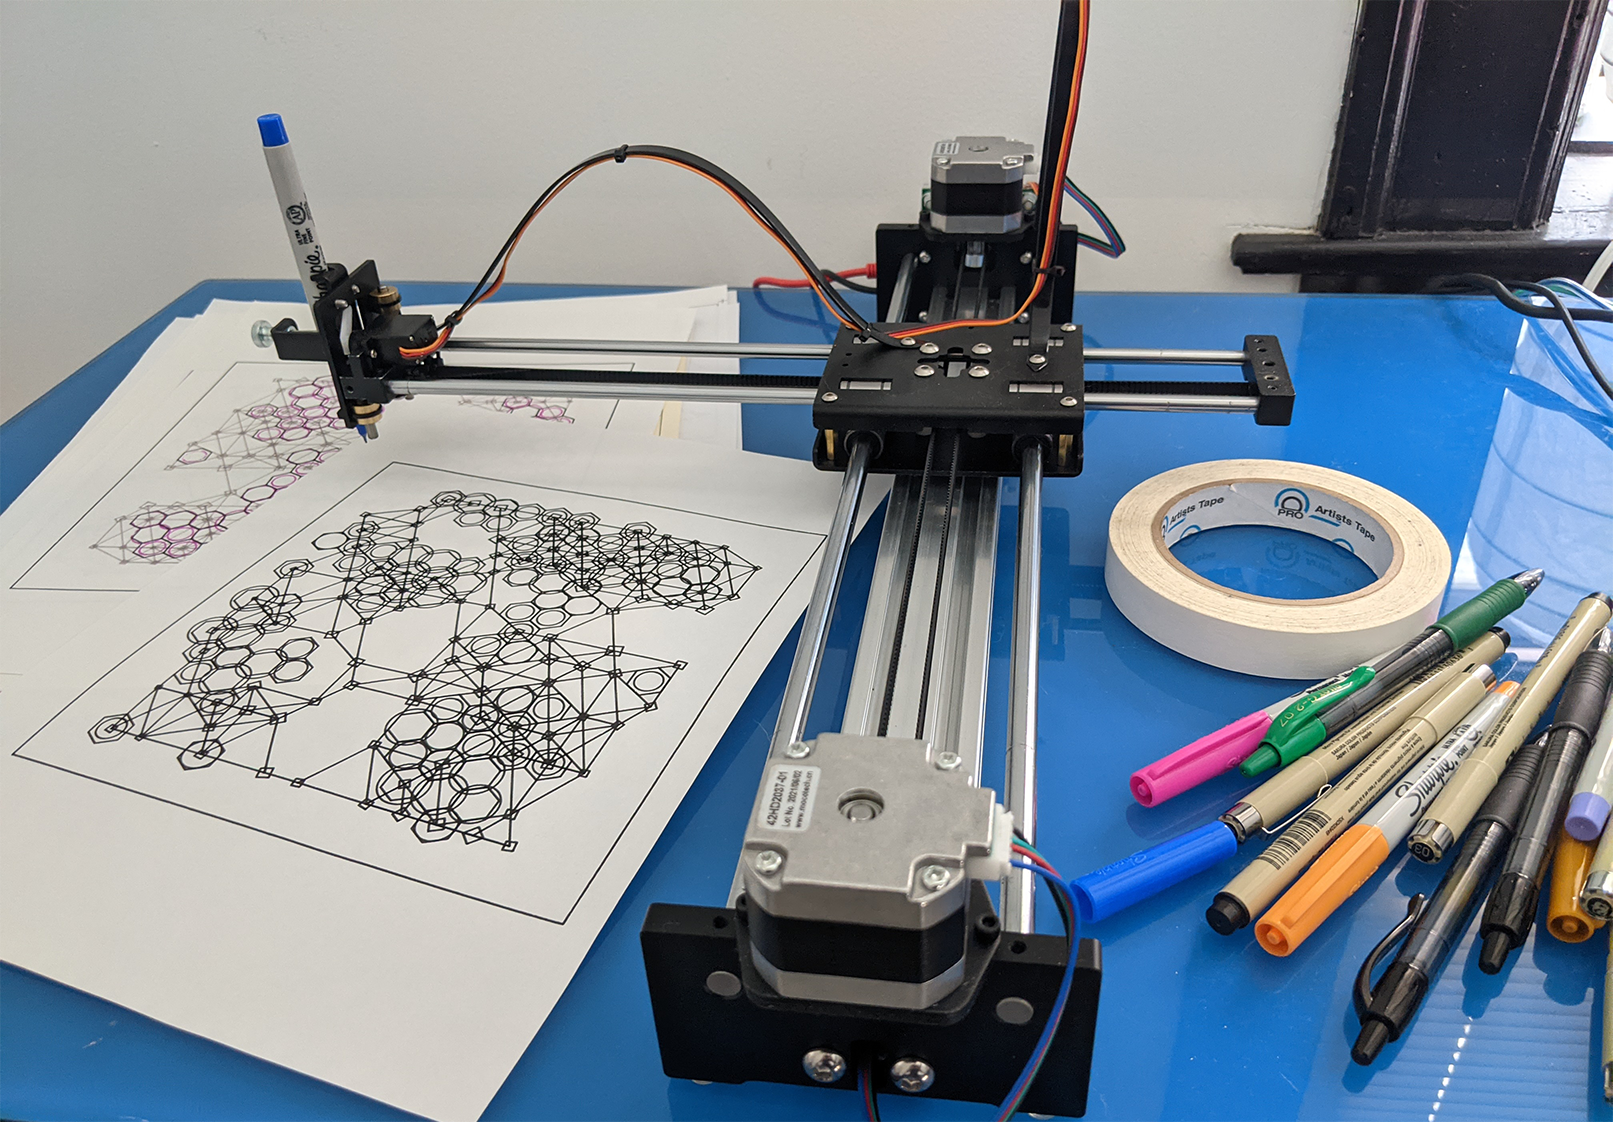
Uunatek was kind enough to send me an iDraw to review, specifically the A4 Metal kit. Below are some details about my experience getting the plotter set up and my initial tests.
The Build Process:
The plotter comes mostly assembled, with only a few key pieces that need to be put together. I found the build to be relatively straightforward, though the manufacturer’s own instructions are not very clear. Uunatek shared this write up from Generative Hut, which I ended up following based mostly on the pictures. The hardest part was getting the belts attached which were tighter than I expected. I took my time with it, and even still it came together in about about an hour. After finishing the build, the device powered on and I was able to successfully successfully plot Generative Hut’s Generative Benchy (included on their review.)
Surprises:
The Generative Hut review shows using the AxiDraw Inkscape extension. I tried this first with no luck, before finding the iDraw extension which successfully connected.
The reset button on the device sets a new home position. It took me some trial and error to discover this, and a few times the plotter tried to draw outside its range.
Opening SVGs directly in InkScape (at least ones created with TD) resulted in dramatic scaling issues with the plotter, even when document settings appeared correct. The method I found to fix this was to create a new document in Inkscape and then import the SVG. As I’m not experience in Inkscape this could also be chalked up to user error.
Pros:
The plotting results look great!
The metal version has a solid build quality (though I can’t compare directly to other plotters.)
Versatile pen holder, allowing for angled and vertical positions, and plenty of room for larger writing apparatuses.
Cheaper than the AxiDraw equivalent
Cons:
Limited documentation and instructions from the manufacturer.
Pictures on the manufacturer’s website are not 100% accurate, namely the pen holder.
You must use Inkscape 1.0 and the included extension files.
My device makes noise related to the sliding of the rods through the bearings. I was told I could use oil to lubricate but wish there had been more information about this. (I still need to determine the type of oil, to be updated!)
Verdict:
While the process was not without friction, the iDraw has been a solid first plotter and I’m exited to see what I can do with further. It was actually much closer to plug-and-play than I expected from an off-brand kit. I will note that I have a degree of tinkering experience (Arduino, rPi and the like) which made the build feel like a breeze in comparison, but with some patience I don’t think such experience is necessary. I’m happy with the build quality of the device and more importantly the quality of the resulting plots.
Vectors and Touchdesigner
One of TouchDesigner’s strengths is that it can work with a variety of file types and formats natively. That said, there are some areas that are beyond the intended scope of the software, and exporting vector graphics is one of them. If you’ve ever looked into pulling your work in TouchDesigner into vector software you’ve most likely come across Matthew Ragan’s excellent SOP-to-SVG converter. It uses the python SVG Write library to save SOPs as SVG files that can be loaded into vector software for use with a plotter or other digital fabrication tools such as laser cutters or CNC routers. Note: while the tool is for TouchDesigner 099 and an older version of Python I had no trouble working with TD 2021:14630 and Python 3.9.
For my first test of the SVG converter, I decided to see what I could get from TouchDesigner’s Trace SOP. I used a Noise TOP, quantized with a Level TOP, and then sent into an Edge TOP to create contours, and then played with the settings in the trace until I liked the outcome. After exporting as an SVG and sending to the plotter I got the result on the right. There are quite a few drawbacks to this method. The quality of lines ended up almost pixelated in the plot (an interesting look, albeit unintentional.) Additionally, the quality of the Trace SOP can only be pushed so far before TouchDesigner stops responding. Ultimately, one could easily get better an image trace with Adobe Illustrator, or another vector software.
My first plot from TouchDesigner. I call it “needs work.”
Instancing Geometry
After my initial tests, the next thing I wanted to do was to expand the SVG converter to support instancing. Instancing geometry is a key aspect of creating generative art in TouchDesigner, however, the output is by nature in raster format (TOPS) and getting those designs in SOP form is not always trivial.
I went through the process of adding a simple 2D instancing setup by to the SVG converter by looping through CHOP instance data and drawing a copy of the source shape for each sample with the appropriate transform. For my first test I decided to translate one of my Instagram sketches, which features a hexagon tiling system from Kohui (a.k.a Noto the Talking Ball.) I created three separate layers, and swapped out a different colored pen for each (right.)
It was only after making this modification that I found Mickey van Olst had already created a better instancing modification of Matthew’s tool that supports 3D transforms! That update can currently be found in this branch, and is certainly worth using over my initial mod (for this reason I haven’t included my own 2D instancing example.) I’ve included the improved instancing example with my example files to make it easier to find. It should work assuming you’ve already installed the python dependencies for the SOP-to-SVG converter.
Hexagon instancing, converted to SVG for the plotter.
Plexus Effect to SOP
After getting my own version of 2D instancing working, I decided to explore a workflow for creating SOPs from sets of points (A and B) to define lines. The impetus to do this stemmed from the desire to create a plexus effect where points are connected based on a distance thresholds. One of my favorite method’s to accomplish this effect comes from Aurelian Ionus (aka Paketa12) who has a math-in-TOPs style tutorial on the subject. I used this as a starter and modified it to output SOP geometry instead of drawing lines with instancing. Above you can see my first work exploring this concept, combining the plexus effect with other instanced geometry.
I’ve included an annotated .tox file for this tool with this article in case it is useful for others. Here are the key points of the process:
The input is expecting a TOP with XY positions stored as RG (16 or 32 bit), packed as a single line. Use the pointRepack tool in the palette under Point Clouds if you need to adjust the size of your texture. Be careful with the number of points you send into this system! Increase the number cautiously to find the maximum that your hardware can support.
Points are fit to a square (nearest pixel), and then “flopped” with the Flip TOP so we have a rotated version as well. These textures represent our point A and point B respectively, as the plexus effects on looking at the distance between each point and every other point.
Distance between is calculated by subtracting the points and then using a Math TOP to calculate length.
This is multiplied by a “mask” of the bottom right diagonal half of the image, as these points are duplicated pairs of points and thus redundant (A to B is the same line as B to A.)
The Chroma Key TOP is used to determine the minimum and maximum distances for our line to be drawn, eliminating points outside of the range.
In the instancing method originally devised by Paketa12 then these lengths are useful for the scale parameter. Instead of using the start point, length and direction to define lines, this system defines the start and end points of lines as position values. The Math TOP at the end of this chain uses "ceiling” to output an integer that’s either 0 or 1. This is then used to determine if that line is drawn or not.
Next we remap our data using a UV map that makes for a smaller texture by rearranging only the unmasked points into a rectangle shape. Up to this point we have mostly been following Paketa12’s method, and this step is especially important for the instancing workflow. It is less important in the case of geometry for a plotter, as there isn’t a need for real-time performance, however I left it here to lean on the GPU to eliminate undesired points before moving to CHOPs (CPU.) The mask, point A, and point B are the three pieces of data we need to generate our lines.
After remapping the TOP data, we go from TOP to CHOP, and then shuffle using “Sequence Channel by Name.”
The “mask” channel is used to trim the points. An Analyze CHOP counts the number of empty points. Sorting the points by the “mask” channel groups the desired points at the beginning of the channels. Then the Trim CHOP can be used to chop of the unwanted tail of the data. Depending on your threshold parameters this could be a lot!
The next step is something I missed on my first go: a sort by first the x points and then the y points to better optimize the plotters route.
The points are interleaved using a Shuffle CHOP set to “Sequence All Samples by Name,” grouping pairs of points together in one channel for x and y respectively.
Last is the CHOP to SOP chain. A Line SOP is copied once for each set of points, which not only gives us the right number of points, but also defines the connectivity. Then, the CHOP to SOP swaps out the XY channels for point position attributes, giving us our plexus effect in a SOP form.
All that’s left is to send the output into the SOP-to-SVG converter and it’s ready to send to plotter!


